

Why 2024 may be the year when small caps bounce back
Key points:
- Following a period of underperformance, small cap stocks look primed for a potential rebound
- Valuations are looking very attractive versus large cap companies
- The end of monetary policy tightening should help the asset class
After lagging the wider market in the wake of aggressive monetary policy tightening, the evolving macroeconomic backdrop looks set to put small cap stocks back in the spotlight again.
Small caps - companies with a market capitalisation of less than €5bn – are typically viewed as higher risk, albeit with the potential for higher returns, when compared to their large-cap counterparts. But because of their typical growth characteristics, the sharp increase in interest rates heavily dampened small caps’ performance in 2022 and 2023, despite decent financial results from many companies.
Even so, at a global level small caps achieved a still respectable total return of 17% over the 12-month period, though large caps delivered a stronger 24%. However, between the end of 2008 and the end of 2023 small caps have outperformed, delivering a cumulative return of 521% against 466% for the large cap index over the 15-year period – although past performance should not be seen as a guide to future returns.
In addition, it’s also sometimes – incorrectly in our view – thought that small caps are much more volatile than their larger peers. Over the longer term, the difference is relatively small, as shown in the chart below.
Small cap versus large cap volatility
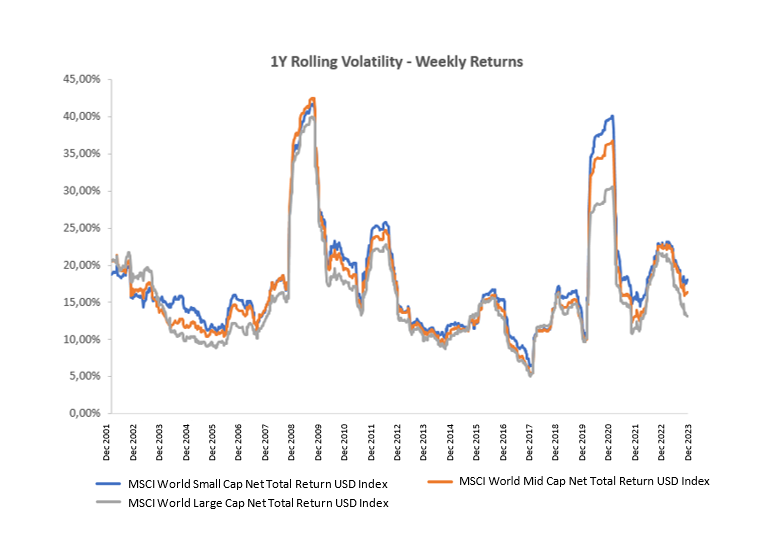
Source: FactSet as at 31/12/2023. Past performance is a not a reliable indicator of future performance. For illustrative purpose only.
What’s more, the Sharpe ratio – which compares risk with return – is currently higher for the MSCI World Small Cap index than for the MSCI World Large Cap index, at 0.44 versus 0.35 respectively.
Given the changing macroeconomic backdrop, we outline why we see potential value for investors in small caps in 2024.
Lower rates and better valuations
The consensus is that interest rates look to have peaked, with markets now pricing in cuts across many major economies in 2024, something which could prove beneficial to small caps.
Higher interest rates can create a more difficult environment for small caps - they can reduce investors’ risk appetite, prompting them to opt for assets potentially less sensitive to monetary policy while the increased cost of capital makes it more expensive and challenging for small caps to raise financing.
But as central banks appear to be broadly winning the battle against inflation, the general expectation is markets should see both the Federal Reserve and the European Central Bank (ECB) start to ease in June – although the ECB will likely follow the lead of the US central bank.
As interest rates start to ease and the broader macroeconomic outlook improves, we expect to see more flows into small caps as risk appetite starts to rise once again.
An advantage of the small caps rout is that it made the asset class’s valuations more attractive with stocks roughly trading in line with large caps - they would usually trade at a premium. Even following December 2023’s strong equity rally, the premium in Europe for example rose from 0.6% at the end of September 2023 to 2.4% by the end of the year - still historically low.
Potentially superior earnings growth
Small caps are often highly innovative and can be more agile in operations and business models when responding to potentially challenging demands or new opportunities. They are also a hive of technological innovation which is becoming increasingly apparent in the transition to clean energy, with small companies benefiting from investment in solar energy, and other clean technologies.
Earnings growth – small caps versus large caps
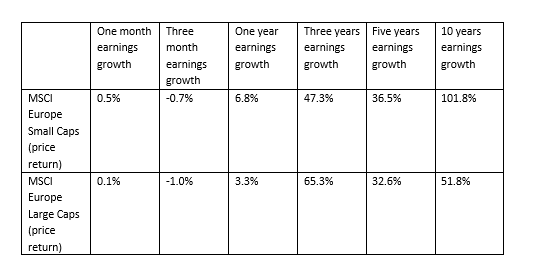
Source: AXA IM, as of 29 December 2023
Fresh opportunities
Small caps may have slipped under the radar for some investors in recent years, but the rate tightening cycle looks to be coming to its nadir. This, alongside the fact that trading valuations are historically low compared to large caps, could be a compelling combination for investors given the sector’s potentially superior earnings growth prospects. However, as always, given small caps’ sensitivity to macroeconomic changes, active management will remain crucial. A more dynamic merger and acquisitions market would be another trigger for the asset class to become more attractive to investors.
Disclaimer
This document is for informational purposes only and does not constitute investment research or financial analysis relating to transactions in financial instruments as per MIF Directive (2014/65/EU), nor does it constitute on the part of AXA Investment Managers or its affiliated companies an offer to buy or sell any investments, products or services, and should not be considered as solicitation or investment, legal or tax advice, a recommendation for an investment strategy or a personalized recommendation to buy or sell securities.
Due to its simplification, this document is partial and opinions, estimates and forecasts herein are subjective and subject to change without notice. There is no guarantee forecasts made will come to pass. Data, figures, declarations, analysis, predictions and other information in this document is provided based on our state of knowledge at the time of creation of this document. Whilst every care is taken, no representation or warranty (including liability towards third parties), express or implied, is made as to the accuracy, reliability or completeness of the information contained herein. Reliance upon information in this material is at the sole discretion of the recipient. This material does not contain sufficient information to support an investment decision.
Issued in the UK by AXA Investment Managers UK Limited, which is authorised and regulated by the Financial Conduct Authority in the UK. Registered in England and Wales, No: 01431068. Registered Office: 22 Bishopsgate, London, EC2N 4BQ.
In other jurisdictions, this document is issued by AXA Investment Managers SA’s affiliates in those countries.
© 2024 AXA Investment Managers. All rights reserved
Image source: Getty Images
AXA IM and BNPP AM are progressively merging and streamlining our legal entities to create a unified structure
AXA Investment Managers joined BNP Paribas Group in July 2025. Following the merger of AXA Investment Managers Paris and BNP PARIBAS ASSET MANAGEMENT Europe and their respective holding companies on December 31, 2025, the combined company now operates under the BNP PARIBAS ASSET MANAGEMENT Europe name.