

How to consider a B/BB US high yield strategy within a portfolio
The US high yield market has performed well in 2023, offering investors attractive all-in yields and a healthy fundamental backdrop during a year that has been marred with uncertainty and surprises. Many high yield companies came into 2023 having taken advantage of cheap borrowing costs from previous years. They have, therefore, largely been able to weather the rising rates environment without needing to refinance. In many cases they have also used free cash flow to pay down debt and de-lever. This can be seen by the fact that both high yield leverage and coverage ratios are coming off historically strong levels, albeit starting to deteriorate towards the end of 2023 as the ‘higher for longer’ interest rate environment drives dispersion higher. This is particularly seen amongst more levered, capital-intensive companies that do not have the cashflow to absorb significant interest rate increases.
Although this increasing dispersion is leading to a pick-up in default activity, driven particularly by a larger proportion of distressed exchanges and borrowers who also have a loan component in their capital structure which is more immediately impacted from higher rates, we continue to believe that corporate fundamentals remain robust enough to prevent the default rate of the US high yield bond market from increasing to a level significantly higher than its long-term average (3.3% according to JP Morgan).
In this environment, we think that a higher quality high yield strategy offers compelling opportunities to investors who are seeking a yield pick-up from investment grade but remain concerned about the macro environment and want to avoid the part of the high yield market which has historically carried the most default risk. Based on our outlook for the economy and current valuations, we believe that this portion of the US high yield market can deliver attractive total returns over the next 12 months and beyond.
Understanding the high yield credit spectrum
For some investors, accessing the full spectrum of the high yield market is not possible due to capital risk or regulatory requirements. For others, it may be possible, but concerns around default rates may dictate a preference for a higher quality approach. An option for such investors may be to take a more selective approach to high yield and invest via a B/BB strategy rather than avoid high yield altogether.
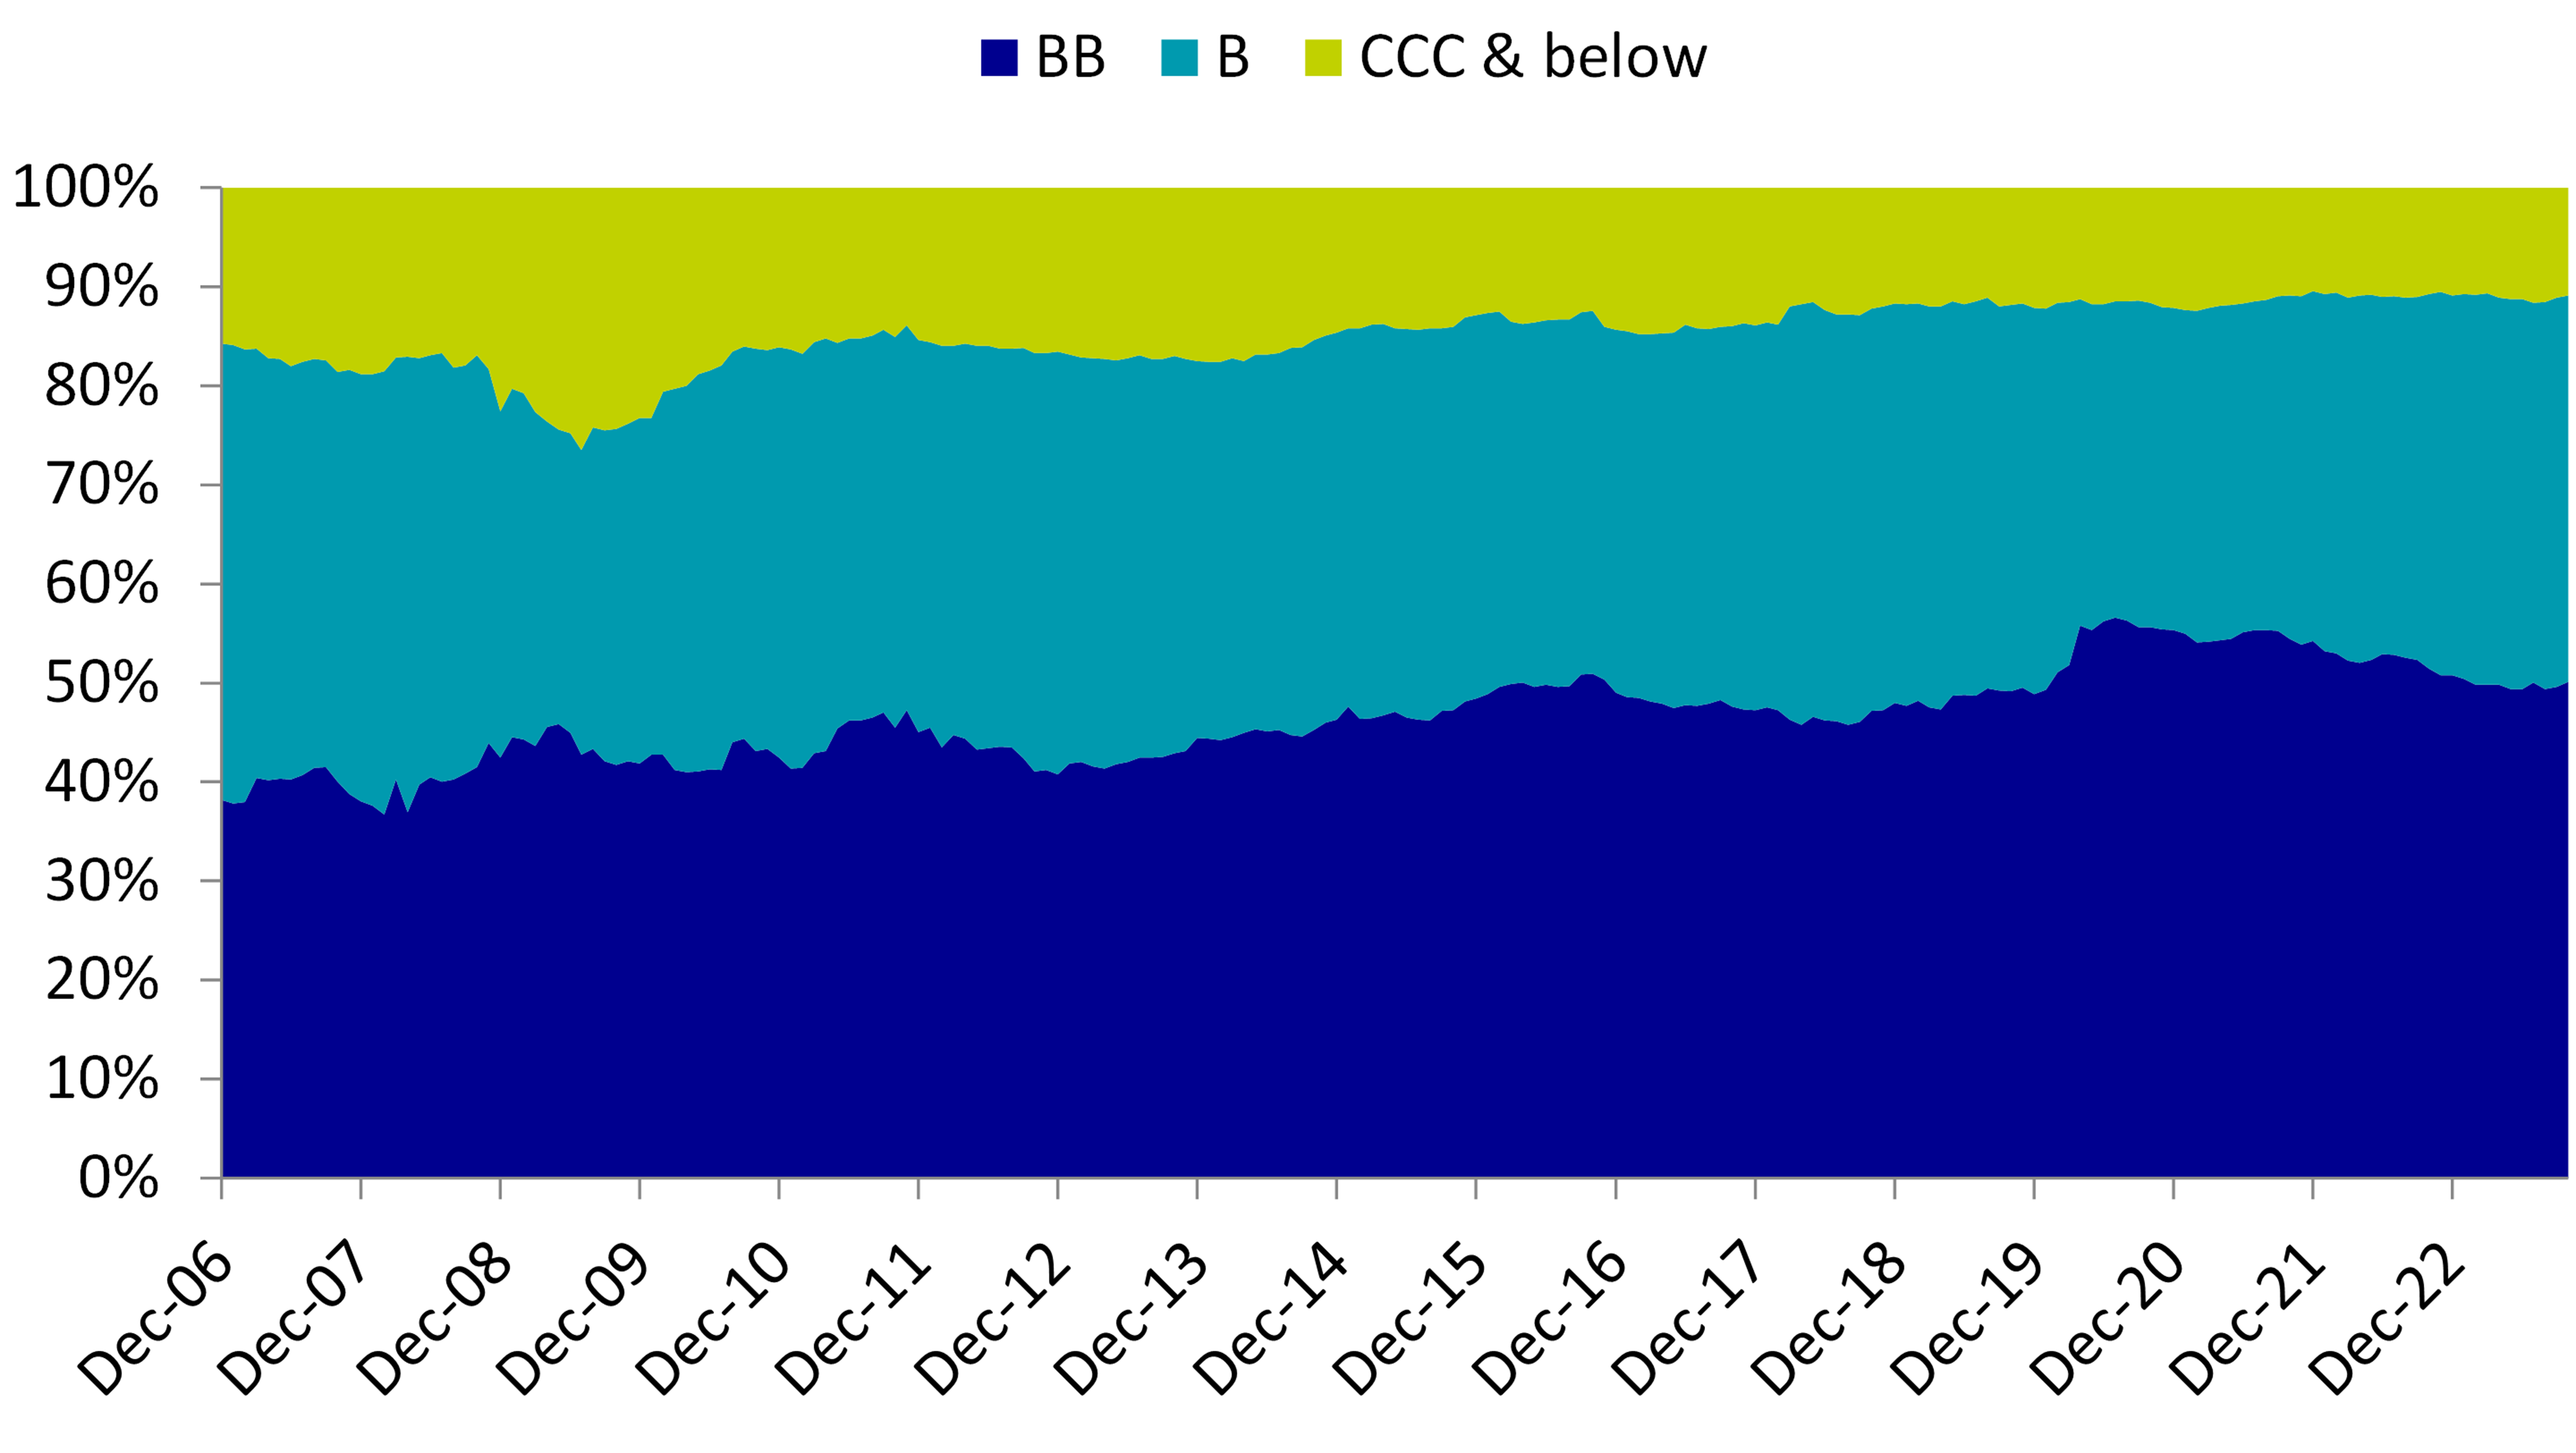
This selective approach to high yield investing does not have to feel like a compromise. Firstly, over the past few years, there have been a wave of upgrades within the US high yield market
Breakdown of the US high yield market by credit rating buckets
Despite representing the smallest rating bucket by market value, the CCC and below component accounts for the largest proportion of default activity within the US high yield market. We believe that the ‘truest’ way of measuring the credit rating spectrum is on an exponential rather than linear scale, with the credit curve acting as an indicator of underlying default risk, measured in spread (basis point) terms. Credit spreads increase exponentially down the curve to compensate for the underlying credit risk, highlighted by the chart below.
This chart, which plots the average spread of different rating buckets across the full US credit spectrum over a 20-year period, shows that the spread differential between BBB and BB rated securities is 154bps, whereas the difference between B and CCC rated securities is higher at 493bps. Therefore, we may consider that, despite BBB and BB securities being differentiated by rating agencies in terms of ‘investment grade’ versus ‘high yield’, they have more in common than BB securities have with CCC securities.
Plotting the US credit spectrum by average spread*
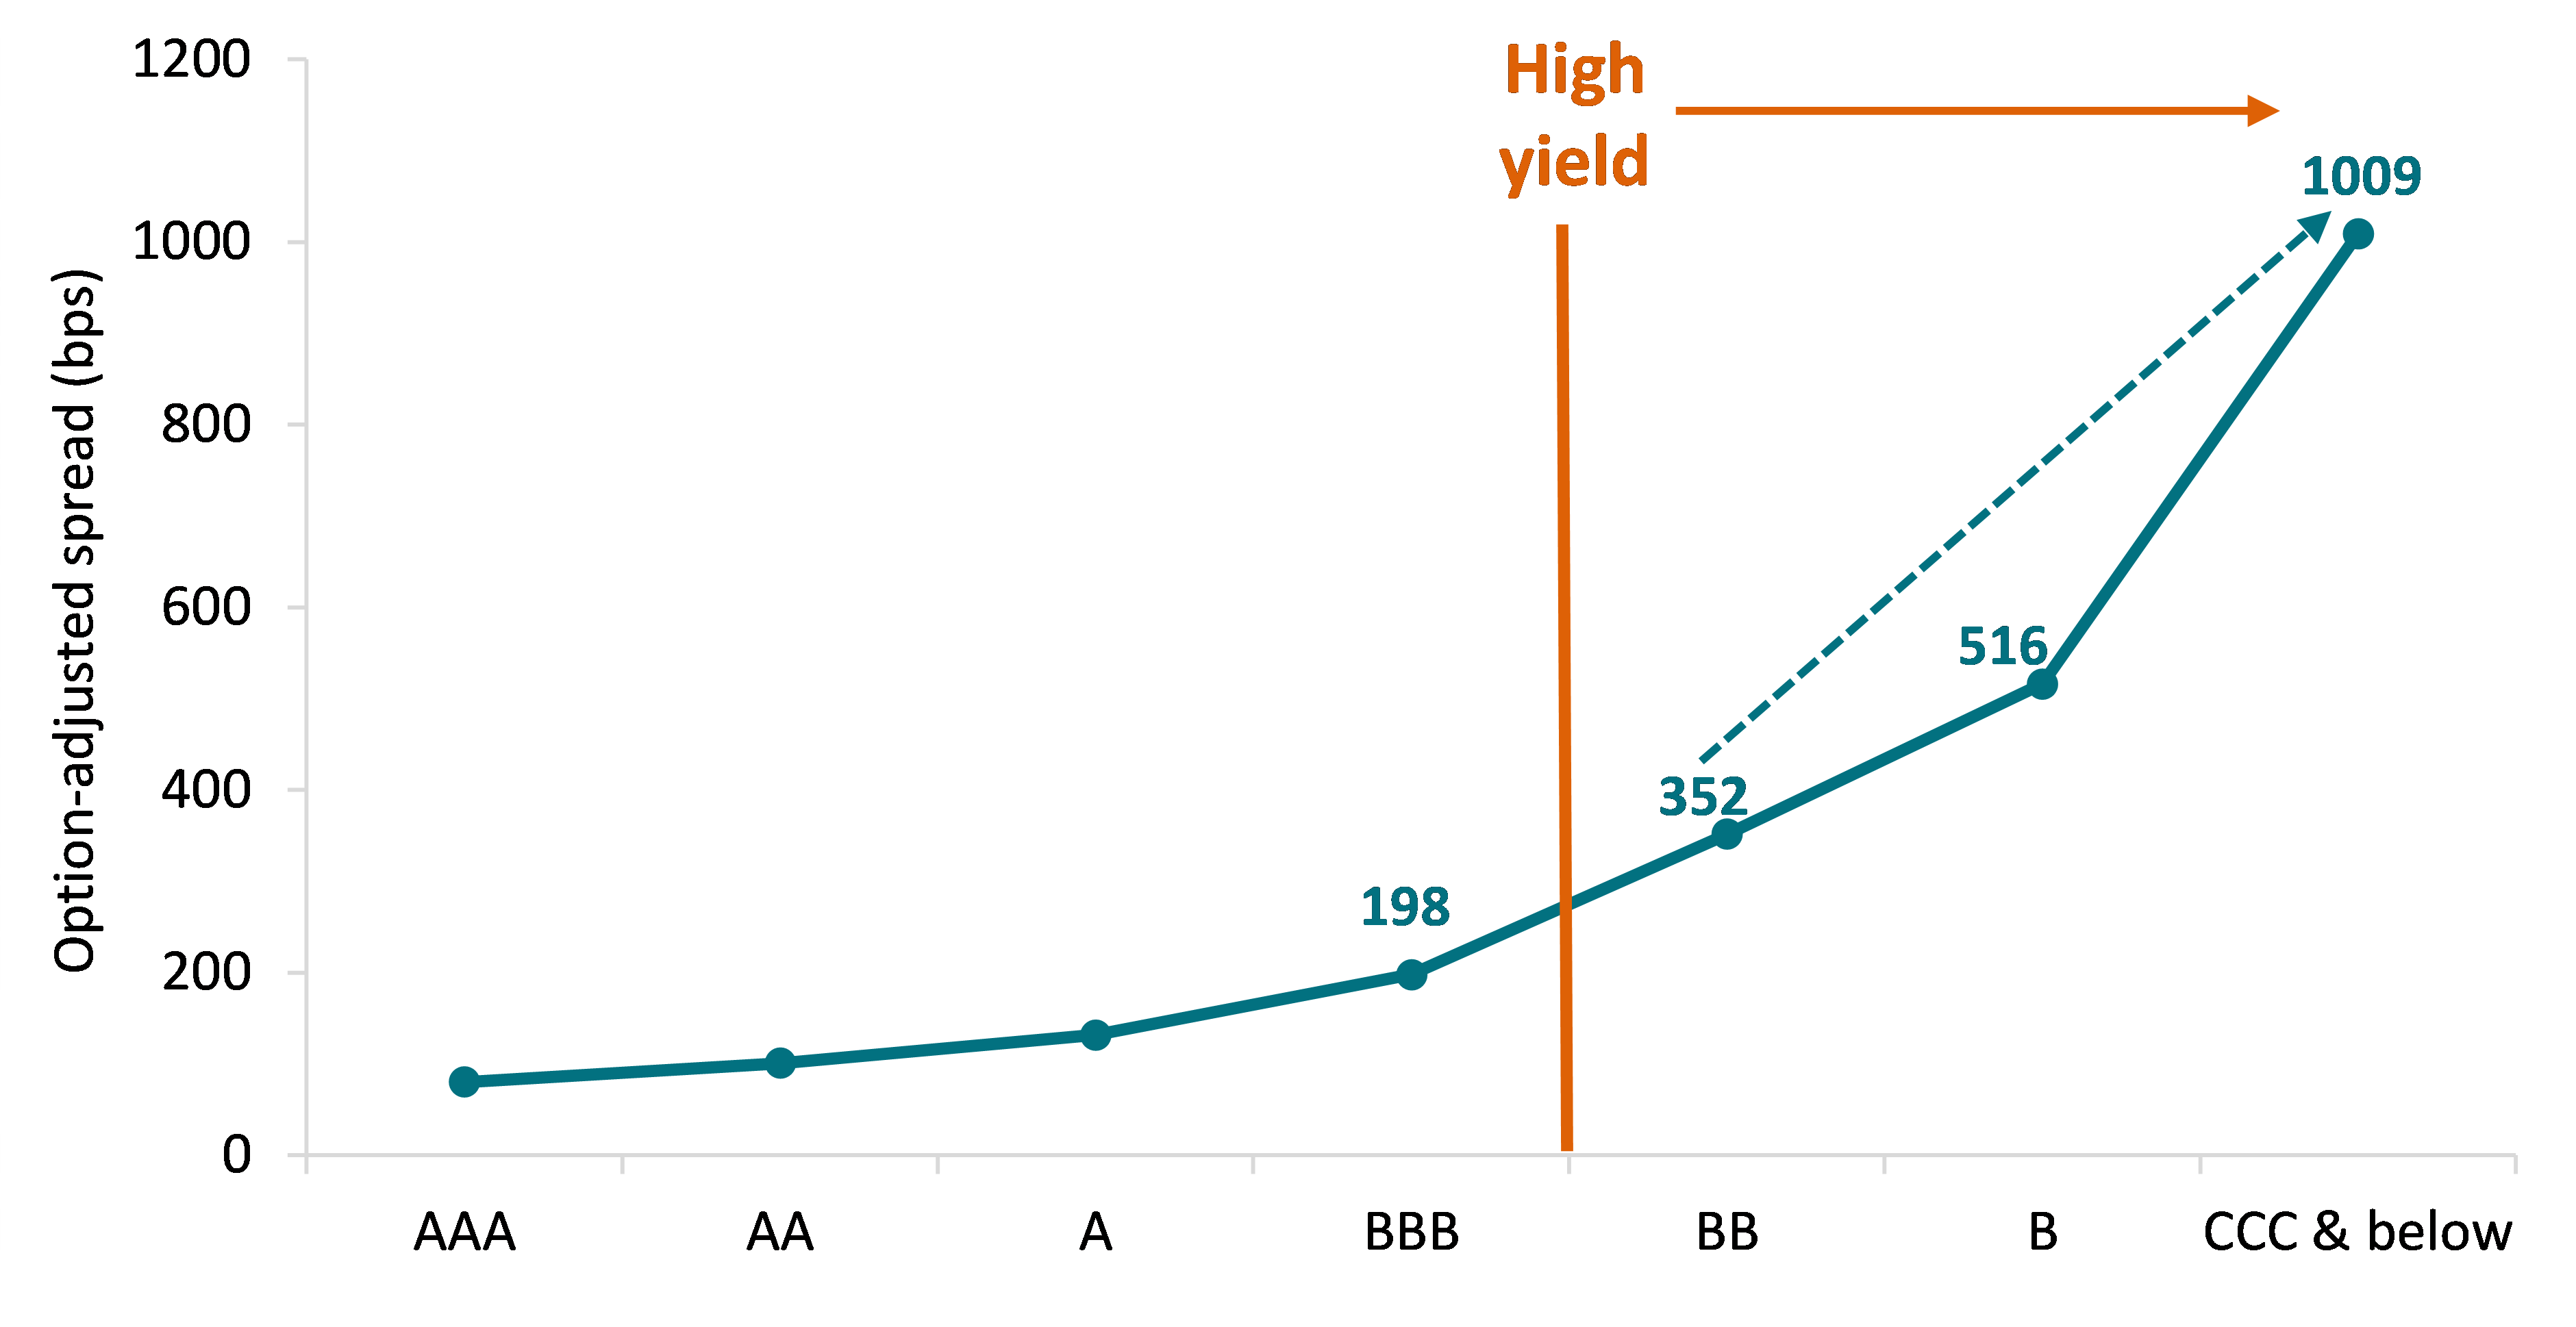
Source: AXA IM, ICE BofA, as of 31 October 2023. * Average spread relates to a 20-year period covering 31 October 2003 to 31 October 2023.
This exponential credit risk is reflected in the fact that the bulk of historical high yield default activity has occurred within the CCC rated bucket. Looking at the 25-year average default rate the largest component of this is CCC/split CCC, tracking at around double the overall high yield default rate of 2.99% for this period:
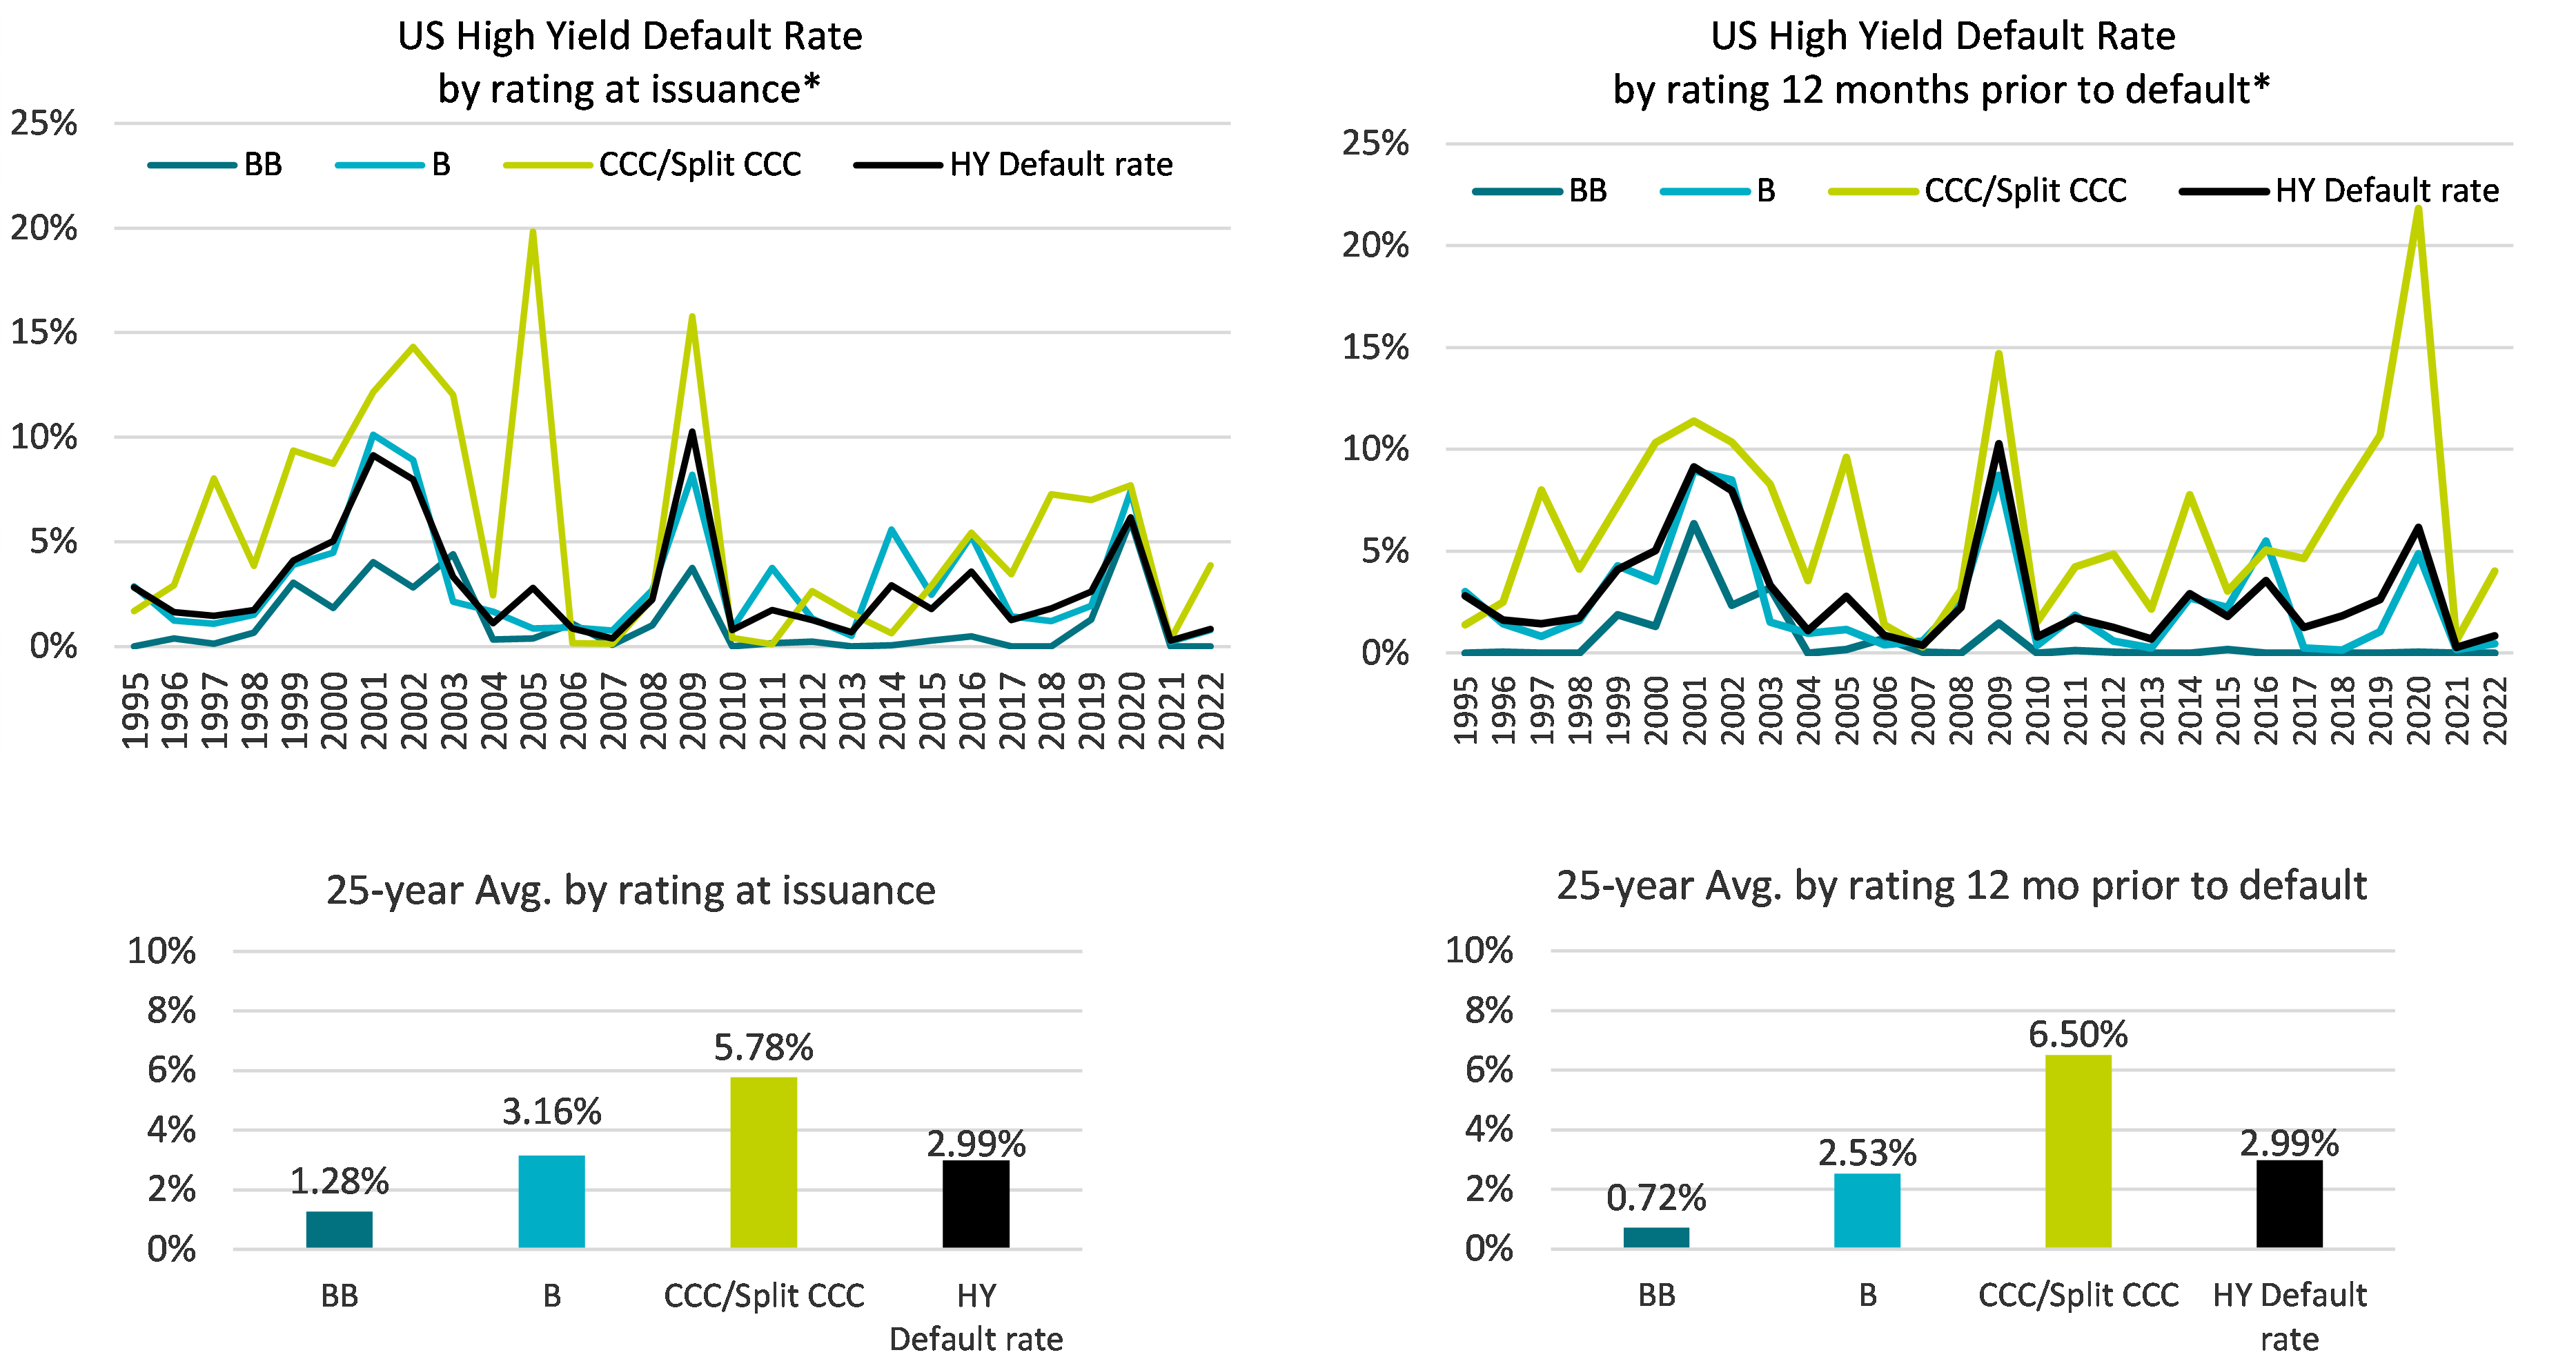
Source: JP Morgan as of 31 December 2022. *Evolution of default rate taking into account full calendar year data, including distressed exchanges. For illustrative purposes only. Investing involves risk and past performance does not guarantee future results. No assurance can be given that the strategy will be successful or achieve its objectives.
That is not to say that we do not like investing in CCC rated securities. To the contrary, we find plenty of opportunities in improving CCC rated credits that may be penalised by rating agencies for having higher leverage and lower asset values, but which we believe have sound fundamentals and hence less business or operational risk. We feel comfortable holding these credits, however believe that robust, prudent credit analysis and active management are required to ensure that we try to avoid losses and defaults.


Disclaimer
This document is for informational purposes only and does not constitute investment research or financial analysis relating to transactions in financial instruments as per MIF Directive (2014/65/EU), nor does it constitute on the part of AXA Investment Managers or its affiliated companies an offer to buy or sell any investments, products or services, and should not be considered as solicitation or investment, legal or tax advice, a recommendation for an investment strategy or a personalized recommendation to buy or sell securities.
Due to its simplification, this document is partial and opinions, estimates and forecasts herein are subjective and subject to change without notice. There is no guarantee forecasts made will come to pass. Data, figures, declarations, analysis, predictions and other information in this document is provided based on our state of knowledge at the time of creation of this document. Whilst every care is taken, no representation or warranty (including liability towards third parties), express or implied, is made as to the accuracy, reliability or completeness of the information contained herein. Reliance upon information in this material is at the sole discretion of the recipient. This material does not contain sufficient information to support an investment decision.
Issued in the UK by AXA Investment Managers UK Limited, which is authorised and regulated by the Financial Conduct Authority in the UK. Registered in England and Wales No: 01431068. Registered Office: 22 Bishopsgate London EC2N 4BQ
In other jurisdictions, this document is issued by AXA Investment Managers SA’s affiliates in those countries.
AXA IM and BNPP AM are progressively merging and streamlining our legal entities to create a unified structure
AXA Investment Managers joined BNP Paribas Group in July 2025. Following the merger of AXA Investment Managers Paris and BNP PARIBAS ASSET MANAGEMENT Europe and their respective holding companies on December 31, 2025, the combined company now operates under the BNP PARIBAS ASSET MANAGEMENT Europe name.