
Reflecting climate-related goals in an ETF portfolio
- 17 April 2024 (3 min read)
For ETF investors looking to reflect the climate-related goals in their portfolios, funds that follow indexes such as the Paris-Aligned Benchmark offer a potential solution.
Identifying ETF that can demonstrate carbon emission criteria clearly has not been a straightforward task. While benchmarks exist for comparing impact portfolios such as green and social bonds, it has been challenging to find a reference point for a conventional portfolio designed to support the transition to a low carbon economy.
This is where benchmarks such as the Paris-Aligned benchmarks (PABs) and the Climate Transition benchmarks (CTBs) offer an option for investors. These benchmarks assess companies’ contributions to the transition to a low-carbon economy. While both PAB and CTB share a similar focus on decarbonisation with an annual 7% target on carbon reduction, there are key differences between the two:
- The Paris-Aligned Benchmark (PAB) aims to achieve alignment with the 1.5°C goal of the Paris Agreement so excludes fossil-fuel intensive companies.
- The CTBs focus on transitioning to a low-carbon economy rather than just limiting global warming.
- PAB requires a more aggressive 50% minimum carbon reduction relative to the market index, as compared to the 30% reduction required for the CTB approach.
The PAB is designed to align with climate goals, typically emphasising sectors and issuers that contribute positively to decarbonisation efforts. It, therefore, has a slightly higher weighting to lower carbon intensity sectors such as Banks, Insurance, Real Estate and Telecoms. On the other hand, it has less exposure than its parent index to other sectors that are highly carbon intensive such as Energy, Utilities and Basic Industry.
This approach goes beyond blanket exclusions and instead has a focus on positive screening. In doing so, the benchmark aims to help fund the transition to a sustainable economy while encouraging issuers in more pollutant sectors to develop more sustainable practises.
Nevertheless, as the chart below demonstrates, the sector weighting differences between the PAB and its parent index remains limited.
Sector relative exposure
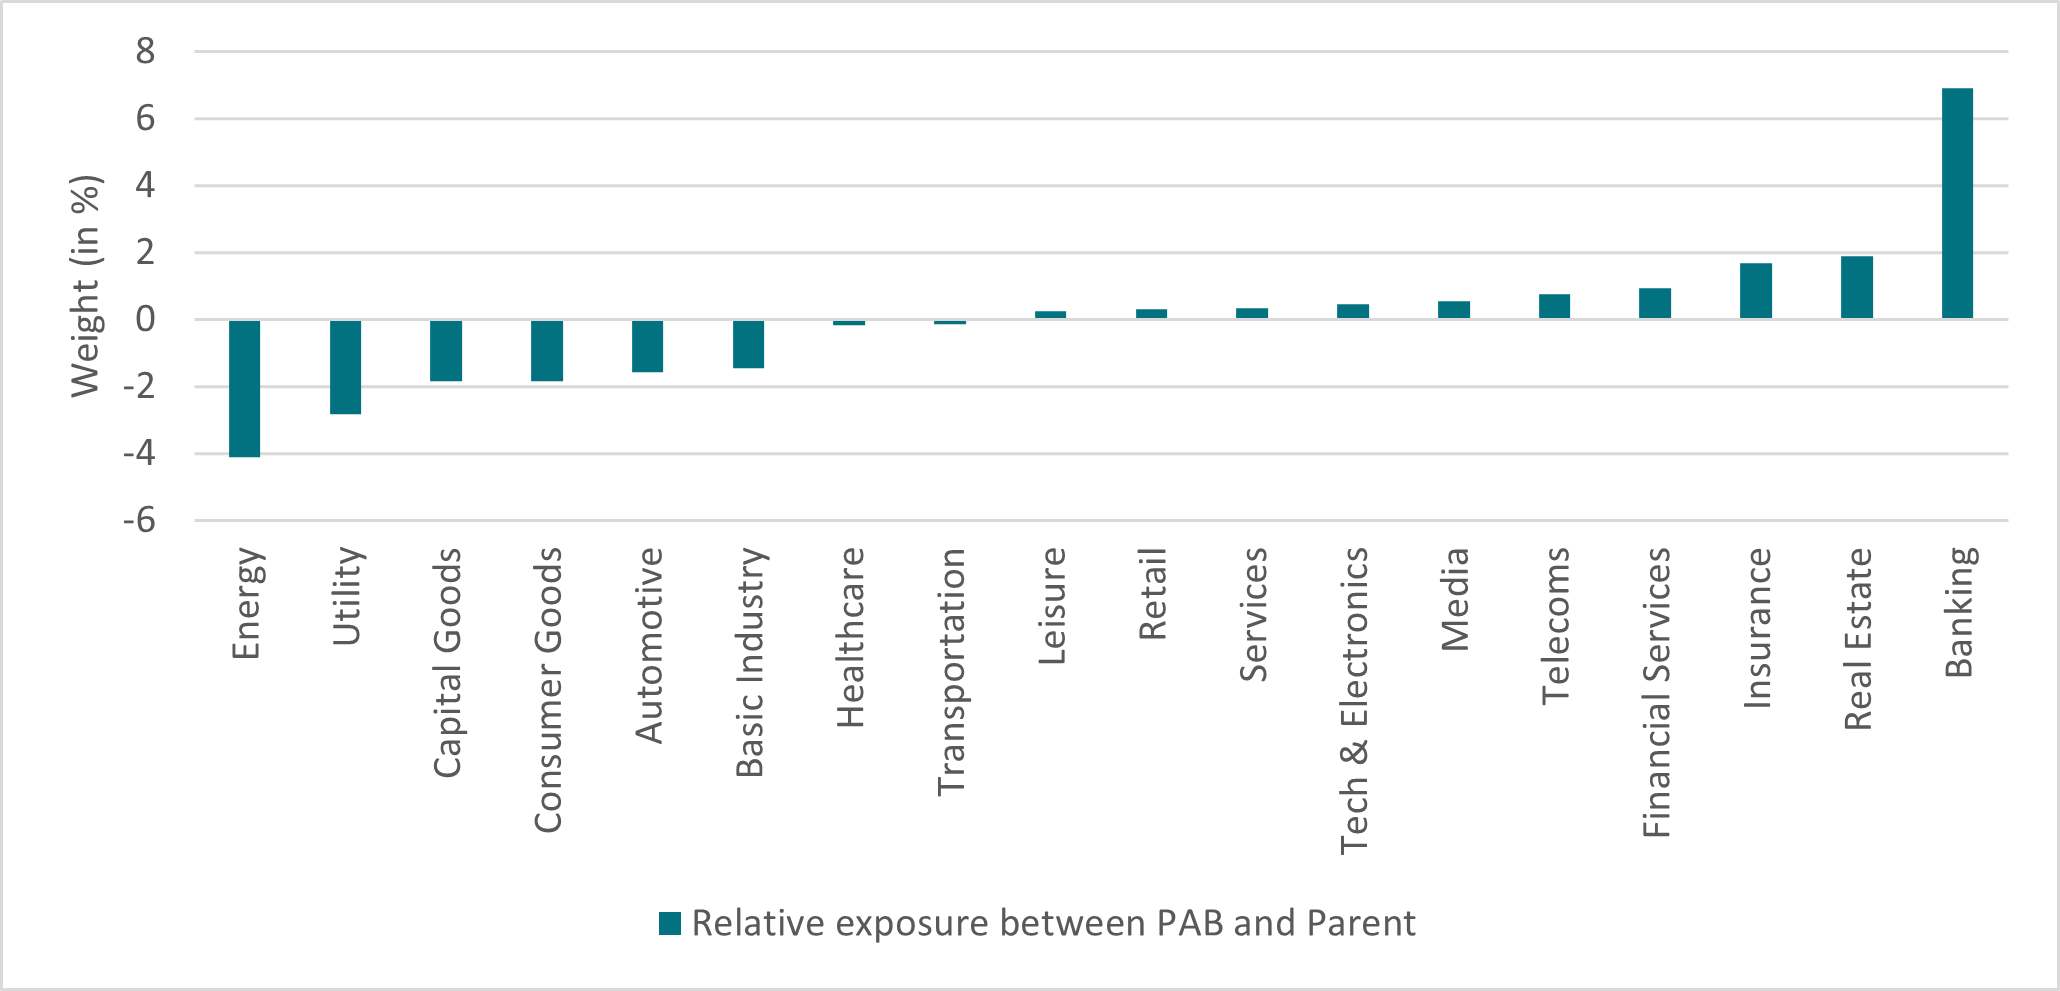
Source: AXA-IM, Bloomberg, as of 25/03/2024. Indices compared: Parent: ICE BofA Euro Corporate Index and PAB: ICE BofA Euro Corporate Index Paris Aligned (Absolute Emissions)
Is there a trade-off for a climate aware approach?
The role of a climate index is to closely track its parent index while sifting out issuers that don’t meet the emission requirements. Therefore, the climate index will have less issues than its parent index, although it still maintains sufficient diversity and liquidity.
Historically, funds looking to reflect decarbonisation in their portfolios would use a standard benchmark and then exclude certain sectors. This led to higher tracking errors because the exclusions meant a more concentrated portfolio. Being able to use a benchmark specifically designed to reflect companies that are contributing towards the decarbonisation should mean that the fund’s tracking error is much lower.
When comparing the ICE BofA Euro Credit Paris Aligned (Absolute Emissions) index with its parent index, they both have similar credit risk profiles with each currently offering an average credit rating of A-1 .
Furthermore, the performance in 2021, 2022 and 2023 was relatively closely correlated. While the data is still limited for comparison given that the PAB was only launched in 2021, these initial years demonstrate that it is possible to not give up returns for sustainable investing, as illustrated in the chart below:
Return for Parent and PAB indices
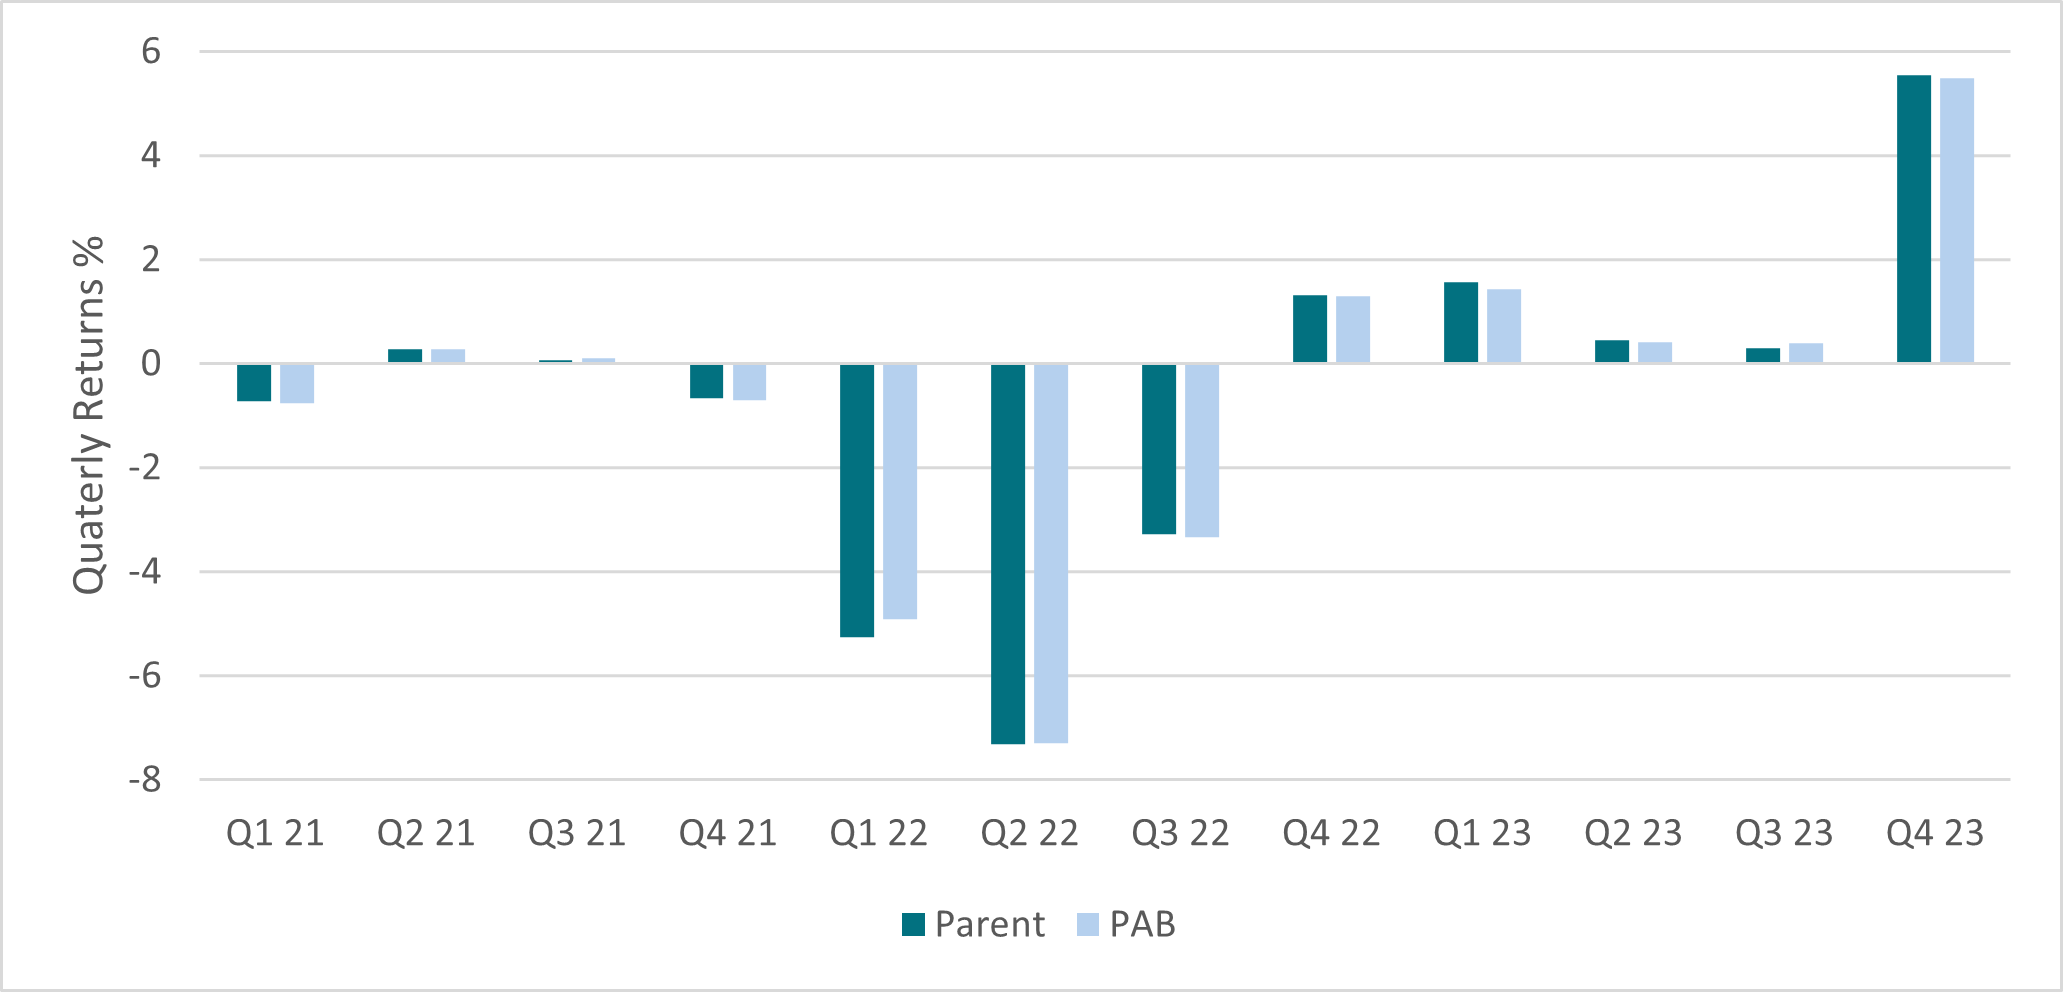
Source: AXA-IM, Bloomberg, as of 25/03/2024. Indices compared: Parent: ICE BofA Euro Corporate Index and PAB: ICE BofA Euro Corporate Index Paris Aligned (Absolute Emissions)
Indexes like PAB and CTB offer investors a solution that allows them to reflect their climate-related goals without having to accept a higher tracking error or more concentrated portfolio.
- U291cmNlOiBBWEEgSU0sIEJsb29tYmVyZyBhcyBvZiAwMyBBcHJpbCAyMDI0
Related articles

What are the risks and opportunities for fixed income in 2024?
- by
- 31 October 2023 (5 min read)

Corporate bonds: the hidden gem of the Active ETF world
- by
- 17 October 2023 (7 min read)

Global future trends in the ETF world
- by
- 02 June 2023 (5 min read)

Active ETFs: A paradigm shift for sustainable investing
- by
- 02 September 2022 (5 min read)

Disclaimer
This document is for informational purposes only and does not constitute investment research or financial analysis relating to transactions in financial instruments as per MIF Directive (2014/65/EU), nor does it constitute on the part of AXA Investment Managers or its affiliated companies an offer to buy or sell any investments, products or services, and should not be considered as solicitation or investment, legal or tax advice, a recommendation for an investment strategy or a personalized recommendation to buy or sell securities.
Due to its simplification, this document is partial and opinions, estimates and forecasts herein are subjective and subject to change without notice. There is no guarantee forecasts made will come to pass. Data, figures, declarations, analysis, predictions and other information in this document is provided based on our state of knowledge at the time of creation of this document. Whilst every care is taken, no representation or warranty (including liability towards third parties), express or implied, is made as to the accuracy, reliability or completeness of the information contained herein. Reliance upon information in this material is at the sole discretion of the recipient. This material does not contain sufficient information to support an investment decision.
Issued in the UK by AXA Investment Managers UK Limited, which is authorised and regulated by the Financial Conduct Authority in the UK. Registered in England and Wales No: 01431068. Registered Office: 22 Bishopsgate London EC2N 4BQ
In other jurisdictions, this document is issued by AXA Investment Managers SA’s affiliates in those countries.