

US high yield: Why the stigma of being a high yield company is not what it once was
KEY POINTS
In the decade and a half since the global financial crisis, regulatory changes and low interest rates have driven a structural evolution of the US High Yield (HY) market.
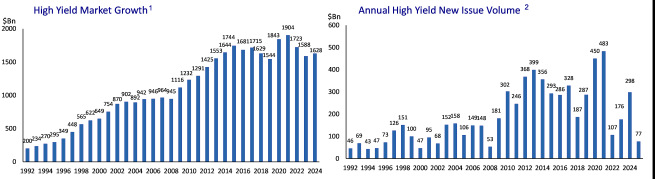
New issue volumes increased dramatically after 2008 as financing costs for HY companies declined, which in turn has attracted a more diverse and increasingly sophisticated range of companies into the market.
Amongst the largest issuers in today’s US HY market are recognised brands and global leaders in their business lines, including Charter Communications, Hilton Hotels and Royal Caribbean, to name a few.
Today’s US HY market can be characterised by improved overall credit quality, better liquidity, lower duration, and a higher proportion of secured bonds than 15 years ago. We feel that, together, these factors leave the asset class in a more solid position to better weather a more uncertain macro environment for risk assets.
In turn, the investor base for US HY has grown and diversified as it has progressively shrugged off the ‘junk bond’ reputation of the past, moving from the fringes to a more common part of a standard asset allocation model.
A post-crisis boom
With interest rates falling to record lows in the aftermath of the financial crisis, companies were able to take advantage of lower funding costs across credit markets, stimulating a pick-up in new issue volumes. Regulatory changes put in place were also successful in encouraging more sophisticated borrowers into the HY market, attracted not only by cheaper rates but also the additional flexibility that HY bonds give companies around their financing needs, as a predominantly callable asset class (allowing borrowers to proactively refinance debt ahead of the original maturity date).
This new supply has been met by increased investor demand given comparatively attractive yields relative to other parts of the fixed income spectrum, with traditional buyers of US HY such as mutual funds, pension funds and insurance companies all increasing their exposure in the decade that followed the crisis.
Improved ratings mix
Coinciding with this growth has been a shift in the composition of the US HY market from a credit quality perspective, with the amount of BBs (at the highest end of the HY rating spectrum) growing from 38% before the global financial crisis to 53% today, at the expense of the CCC and below rated issuers (the lower end of the spectrum), which today account for just 11% of the market relative to 16% at the end of 2007.
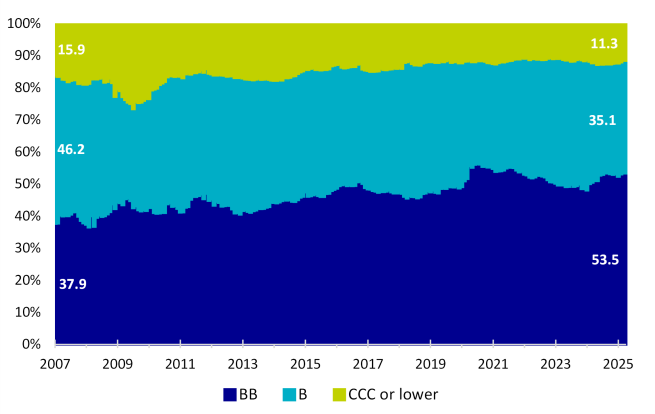
This trend towards a better quality HY market has accelerated in the post-pandemic period since 2020 and reflects the scale of credit improvements made by HY issuers – using the fall in interest rates that occurred after March 2020 to push out maturities and refinance at low levels, thereby locking in lower financing costs. This allowed many HY companies to use the extra cash that had built up on the balance sheet to reduce leverage and improve interest coverage, which by the early part of 2023 were coming off all-time lows (low leverage being a positive fundamental signal) and highs (high interest coverage being a positive fundamental signal) respectively.
As a result, the market has witnessed record amounts of rising stars moving from HY to investment grade (IG) in recent years, with $282bn of rising stars elevated between 2022 and 2024 compared with a meagre $37bn of fallen angels moving the other way.
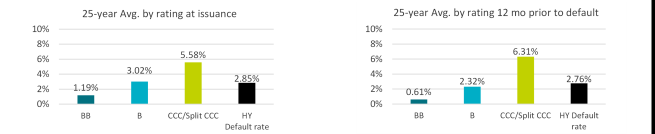
This is also significant in accounting for the declining US HY default rate over this period. Since the 2020 pandemic-induced peak in defaults at some 6% (excluding distressed exchanges), the par-weighted 12-month trailing HY bond default rate has declined to just 0.3% as of April 2025 (or 1.3% including distressed exchanges).
*Evolution of default rate taking into account full calendar year data, including distressed exchanges. For illustrative purposes only. Investing involves risk and past performance does not guarantee future results. No assurance can be given that the strategy will be successful or achieve its objectives.
Higher proportion of secured HY bonds
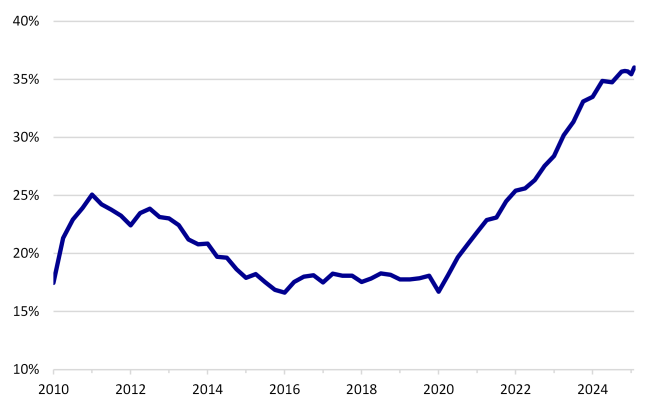
Furthermore, there has been growth in the proportion of HY new issuance that is secured (first or second lien) over the last few years, which has priority over unsecured debt in the capital structure due to being backed by underlying assets that provide an extra level of protection to the lender in the event of a default.
This offers higher recovery rates to creditors, which acts as compensation for lower coupon rates than an equivalent unsecured bond. The surge in secured issuance, which now makes up nearly one-third of today’s US HY market, can be explained as one of the ways in which issuers have adapted to the higher interest rate environment since 2022, allowing them to minimise interest expense at a time when financing costs have increased relative to 2020 and 2021.
The valuation differential between a secured and unsecured bond within the same capital structure will vary according to the quality the company. For a deteriorating credit situation, however, an unsecured bond may trade down towards a substantially lower floor relative to the secured. Therefore, the principal impact of the growth in secured HY debt is in anchoring credit spreads and price declines during sell-offs, even though each situation will be idiosyncratic in nature. Generally speaking, if there is a lot of equity value, either implied or explicit, behind the unsecured bond, then it will trade tighter to the secured equivalent because the chance of that company defaulting is much less. The less equity value behind the unsecured bond, the wider it will likely trade to the secured.
A topical case study can be found in the HY issuer Altice France (SFRFP), which is currently engaged in a liability management exercise amid restructuring talks.

A new normal for spreads?
At the height of April’s tariff-related volatility, US HY spreads widened by 103 basis points (bp) in two days
So, what comes next? Did the entry point come and go in the blink of an eye, or has a more material widening been pushed out? April’s peak came close to the post-crisis (2010 - today) average of 465bp but was still comfortably within the non-recessionary historical average spread of 496bp. Interestingly, the post-crisis average spread of 465bp is a leg lower than the before the crisis (1996 – 2007) average spread of 507bp.
However, given the structural changes in US HY market composition, comparing spread levels today with longer-term historical averages may be inherently flawed, even if recent ranges have certainly been expensive relative to any yardstick. Putting a number on what the ‘new normal’ average HY spread might be over the next 15 years is anyone’s guess, but there is a fair argument to suggest that it will be lower again than the previous 15 years.
This is not only due to factors discussed above, but also due to improvements in liquidity made possible over the years by the proliferation of electronic trading and portfolio trades, which have partly facilitated a decline in HY bid-ask spreads. Meanwhile, due to shifting dynamics across the leveraged finance landscape, stressed issuers across both the HY bond and BSL (Broadly Syndicated Loans) markets that may have gone on to default in the past now have the backstop of accessing capital flowing in from private credit. This has been positive in contributing towards a lower default rate, but due to the greater availability of capital today, it could also drive coupons down in the future.
Ultimately, we think it is likely that spreads could experience further bouts of volatility over the next 12 months as macro and political events unfold, but we believe they are better anchored today than in the past. Defaults may well pick up from a very low base, but with fundamental and technical factors still proving supportive, on current reading we do not see the HY default rate picking up to levels higher than long-term averages (3.1%, including distressed exchanges) – even with heighted uncertainty on the macro front. In this scenario, spreads should continue to find support from buyers on any widening, as happened towards the end of April and into May.
From fringe to core component
Amid ongoing demand for higher yielding asset classes, we believe these shifting dynamics towards a higher quality US HY market and across broader leveraged finance makes a strong case to become an increasingly common component of a standard asset allocation model.
As April’s episode demonstrated, drawdowns in HY don’t tend to last for long and, for an asset class driven predominantly by income over the long run, trying to time the bottom may ultimately be futile over a medium-to-long term investment horizon.
HY can also offer important diversification qualities within a broader asset allocation, offering the potential for attractive income-driven returns that can compete with equities with lower volatility, whilst also complementing longer duration fixed income assets, given its naturally shorter maturity profile.
We believe that these structural benefits, shifting composition and unique diversification qualities have rendered the old stigma associated with the HY market obsolete and that maybe, just maybe, it can shake off the junk bond reputation for good over the coming decade.
Companies shown are for illustrative purposes only as of 19 May 2025. It does not constitute investment research or financial analysis relating to transactions in financial instruments, nor does it constitute an offer to buy or sell any investments, products or services, and should not be considered as solicitation or investment, legal or tax advice, a recommendation for an investment strategy or a personalized recommendation to buy or sell securities.


Disclaimer
This document is for informational purposes only and does not constitute investment research or financial analysis relating to transactions in financial instruments as per MIF Directive (2014/65/EU), nor does it constitute on the part of AXA Investment Managers or its affiliated companies an offer to buy or sell any investments, products or services, and should not be considered as solicitation or investment, legal or tax advice, a recommendation for an investment strategy or a personalized recommendation to buy or sell securities.
Due to its simplification, this document is partial and opinions, estimates and forecasts herein are subjective and subject to change without notice. There is no guarantee forecasts made will come to pass. Data, figures, declarations, analysis, predictions and other information in this document is provided based on our state of knowledge at the time of creation of this document. Whilst every care is taken, no representation or warranty (including liability towards third parties), express or implied, is made as to the accuracy, reliability or completeness of the information contained herein. Reliance upon information in this material is at the sole discretion of the recipient. This material does not contain sufficient information to support an investment decision.
Issued in the UK by AXA Investment Managers UK Limited, which is authorised and regulated by the Financial Conduct Authority in the UK. Registered in England and Wales No: 01431068. Registered Office: 22 Bishopsgate London EC2N 4BQ
In other jurisdictions, this document is issued by AXA Investment Managers SA’s affiliates in those countries.
AXA IM and BNPP AM are progressively merging and streamlining our legal entities to create a unified structure
AXA Investment Managers joined BNP Paribas Group in July 2025. Following the merger of AXA Investment Managers Paris and BNP PARIBAS ASSET MANAGEMENT Europe and their respective holding companies on December 31, 2025, the combined company now operates under the BNP PARIBAS ASSET MANAGEMENT Europe name.